Answer:
. In figure 1, point A is constructed as the focus and line BD as the directrix.
Figure 1
2. Next, point C is randomly constructed on segment BD. Through C, a line perpendicular to segment BD is constructed. Point C must be constructed randomly to insure that the perpendicular line can move along segment BD.
Figure 2
3. Now, segment AC is constructed with its perpendicular bisector line FE.
Figure 3
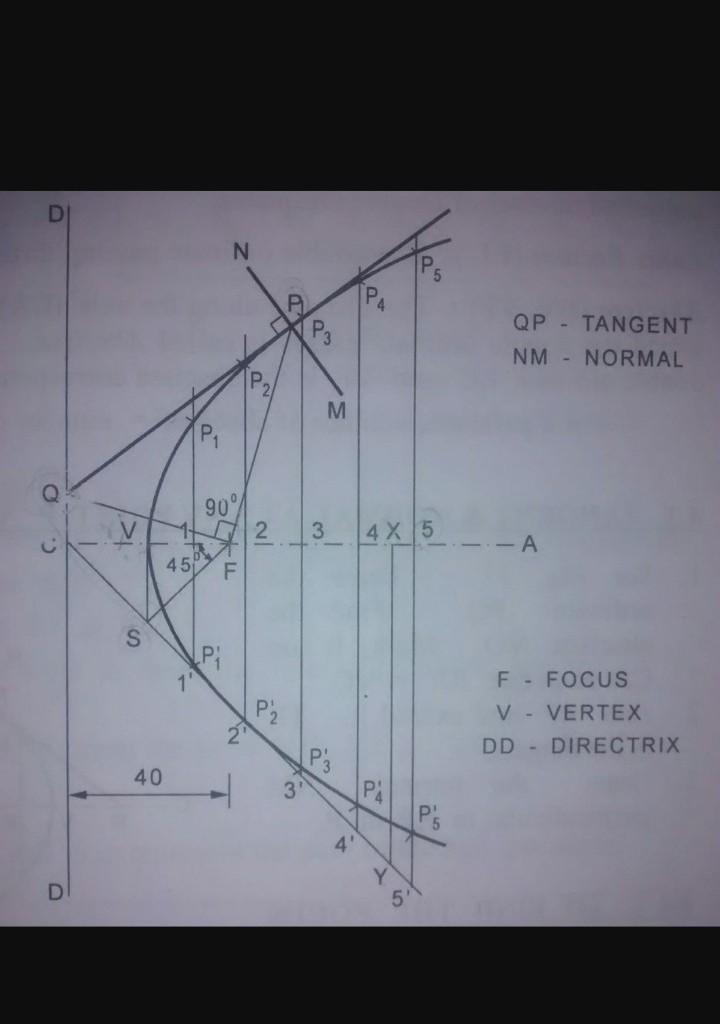
To understand this step, it might be helpful to keep in mind the definition of the parabola and to think about its vertex. Its vertex will be located at point E halfway between line BD and point A when the perpendicular is in line with point A. (See figure 4.)
Figure 4
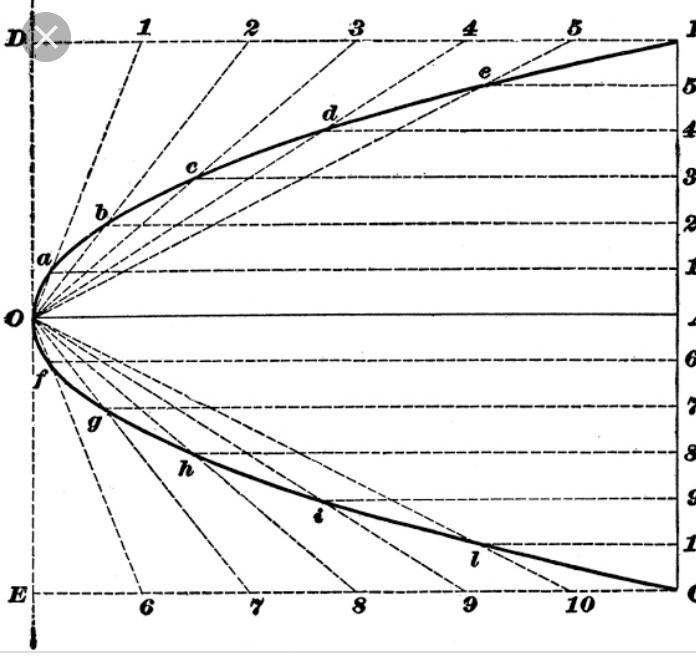
4. Next, select point F, choose “trace” from the Display Menu and then drag point C back and forth along segment BD to draw the parabola as shown in figure 5. (The more you “trace” the parabola the darker it becomes.)
Figure 5
To download a GSP animation of figure 5, go here and select “Animate Point.”
5. Geometer’s Sketchpad allows for two alternate constructions of parabolas as well.
a. The parabola in figure 6 has been created by tracing the perpendicular line FE as point C is dragged along segment BD.
Figure 6
b. The parabolas in figures 7 and 8 have been constructed using the locus command in the Construct Menu. (Figure 7 uses points C and F and figure 8 uses point C and line FE.) Note that this command yields the same results found above.
Figure 7
Figure 8
Connections to the other Conic Sections
6. What if the directrix was a circle instead of a line?
a. Consider figure 9 when point A is outside circle O and the line perpendicular to segment AB has been selected to trace. When point B is moved around the circle, a hyperbola is created.
Figure 9
b. Now consider figure 10 when point A is inside the circle. When point B is moved around the circle, an ellipse is created.
Figure 10


